

Our method: connecting people, technology and systems. We connect people, technologies and systems. We won’t succeed on our own; we’ll only succeed in harmony with our environment, our customers and partners, and with motivated and forward-thinking staff.
L'édito de Vincent BedouinWEB LS
A dedicated platform for centralisation, hosting and processing of data from SOFREL LS and LT data loggers
SOFREL WEB LS is the Cloud hosting solution dedicated to SOFREL LS and LT data loggers. Completely secure, WEB LS offers operators the ability to remotely manage their fleet of data loggers and to process data transmitted daily from devices.
WEB LS is a user-friendly solution which eliminates the need for local authorities to invest in a SCADA system of much greater implementation complexity.
Fully responsive (HTML5), WEB LS can be used via any web browser on PC, tablet or smartphone, thereby allowing users to consult and exploit data while on the move.
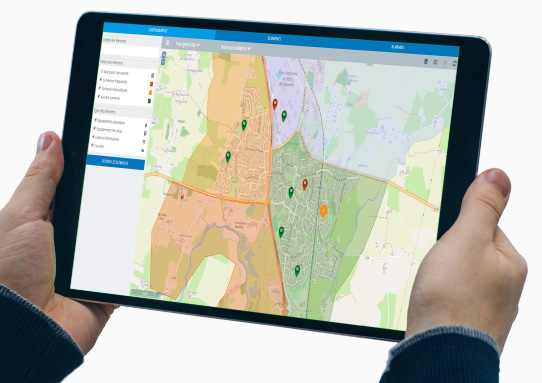
Key information from data loggers is first shown on an interactive map, providing the user with an overview of their network’s performance.
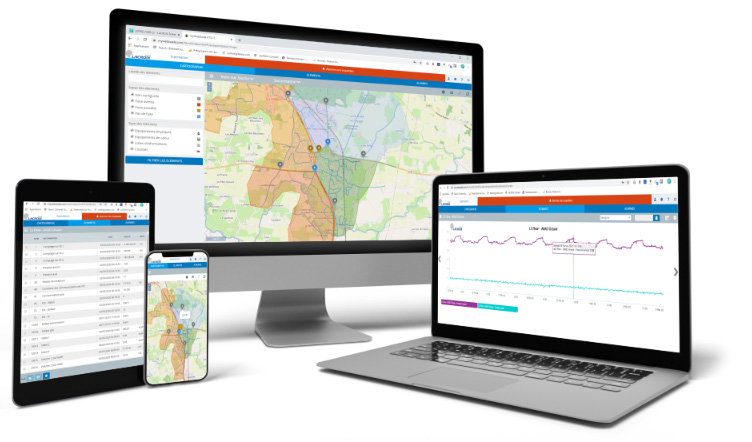
Next, all data from a specific site can be accessed in order to analyse its time-related performance, after which it can be exported for sharing and archiving.
As well as data analysis, WEB LS also enables network operators to remotely modify the configuration of a data logger, thereby avoiding costly travel and intervention time.
Finally, WEB LS provides Web services for sharing field data in a secure manner with the SCADA solutions and hypervision centres of major operators and local authorities.
Widely adopted by operators of networks both large and small, the WEB LS platform is currently used to centralise over 20,000 SOFREL data loggers worldwide, and handles millions of data items every day.
Secure hosting
- Certified industrial hosting (availability rate 99.5%)
- Secure data exchange via HTTPS connections
- Password-secured and partitioned access (only the user can access their network data)
Download the WEB LS brochure
A simple, effective solution for remote management of your data logger fleet

- LS/LT geolocation via dynamic mapping
- Predictive maintenance (monitoring device battery level and communication performance)
- Remote configuration modification
- Temporary operational exemptions
- External GIS interfacing
Automated data processing
- Calculations on archives triggered periodically, on request or in response to events
- Calculation of average flow on each meter index archive
- Periodical balances (daily, weekly, monthly, event-based) for meters, measurements or logical data (duration, number)
- Automatic archiving of calculated information
Dedicated processing functions for an immediate understanding of your network’s operational status
- Interactive mapping
- Customised views, animated colour markers, zone layer display
- Sector analysis tables
- Performance analysis on a network, site or data logger according to several indicators for monitoring:
- upstream and downstream pressure on a section
- volumes and flows (min, max, average, night-time) by critical points
- overflows (number, volume, duration) in Combined Sewer Overflows
- Identification of points of malfunction or under-performance
- Performance analysis on a network, site or data logger according to several indicators for monitoring:
- Dynamic, zoomable curves with the ability to compare several indicators simultaneously
- Export data from history in Excel
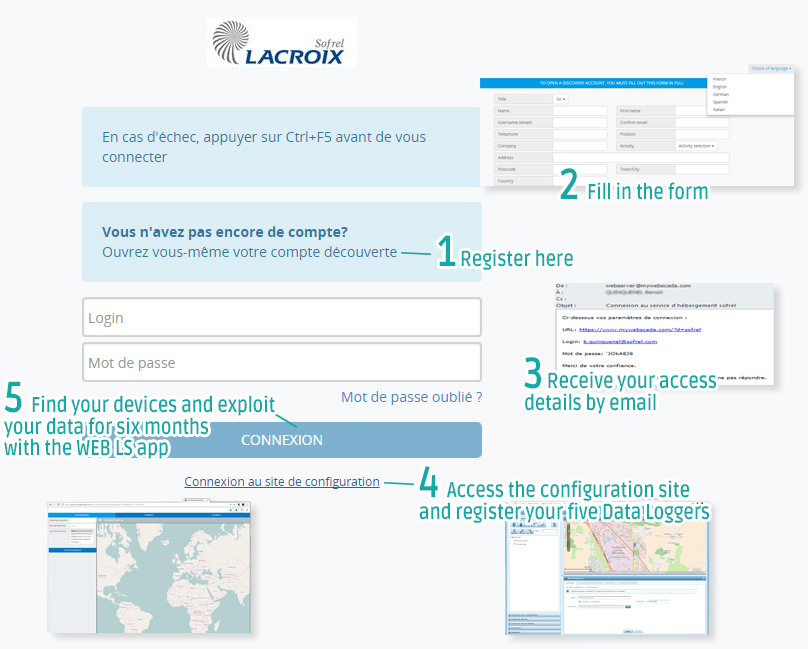
Try the WEB LS service for free
With the introductory offer, you have six months to try out all the features of the software and process data from five data loggers.
Create your WEB LS account right now by clicking here.
WEB LS demo access
Login : demo@demo.en
Password : a00000
Login : demoLT@demo.en
Password : a00000